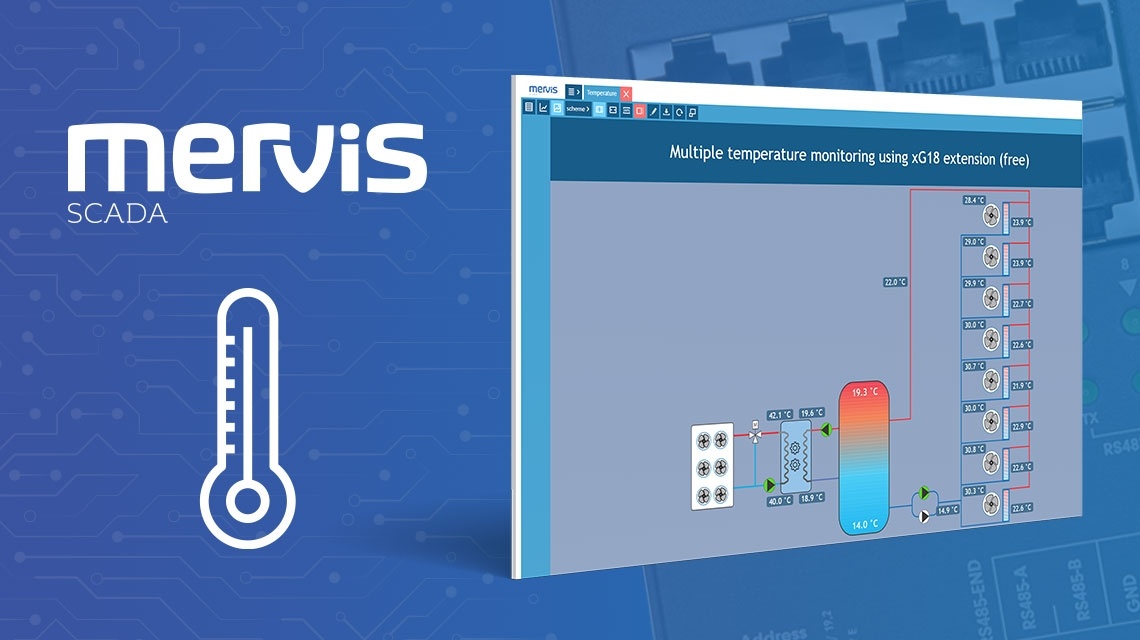
Learn about the advantages of Mervis SCADA with a demonstration project for monitoring multiple temperatures using the xG18 extension modules.
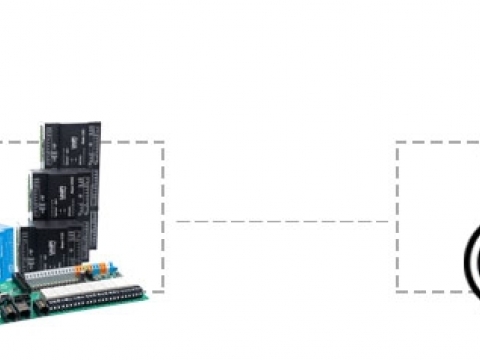
Looking for a way to measure multiple temperatures simultaneously online and for free while keeping track of the measured values? The solution is our demonstration Mervis SCADA project for measuring of up to 24 temperatures that combines an Unipi programmable logic controller, Unipi Extension xG18 modules, and inexpensive Unipi 1-Wire temperature sensors. The solution is created in the Mervis IDE development environment, while Mervis SCADA service is used for remote control and monitoring (see below).
What are the project’s advantages?
- the project is available for free and can be used for an unlimited time,
- pre-assembled project - you need only to connect the required components for the startup,
- the project can be edited as needed,
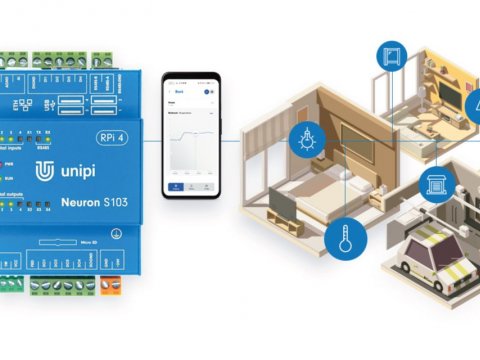
- ability to remotely monitor up to 24 temperatures from any place on the world via your computer, tablet, or mobile app in your smartphone,
- an option to manage the project remotely,
- the number of connected sensors can be changed at anytime.
The project is available on this link, where you can also find a detailed guide on how to start the project in Mervis IDE.
Possible applications
The solution is applicable in installations requiring temperature monitoring g such as boiler rooms, heat exchanger stations, refrigeration facilities, data centers, and other similar objects, objects in need of data logging and archiving. The solution is also useful as a source of data for HVAC control systems in objects such as hotels, office buildings, or factory halls.
What will you need?
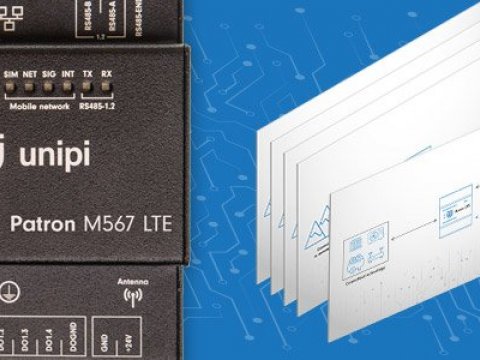
- Unipi Neuron S103 controller (can be replaced by ani Unipi Neuron/Patron PLC),
- a MicroSD memory card with Mervis OS image,
- installed Mervis IDE development environment,
- 24 V power supply,
- 3× Unipi Extension xG18 module,
- 24× Unipi 1-Wire temperature sensor,
- internet connection,
downloaded Multiple temperatures monitoring using xG18 modules (free) project (see above).
Scaling the project
The project is not limited only to 24 sensors, as their number can be reduced without the need for any extensive adjustments. If you need less than 24 sensors, you can simply remove the unneeded data points in Mervis IDE.
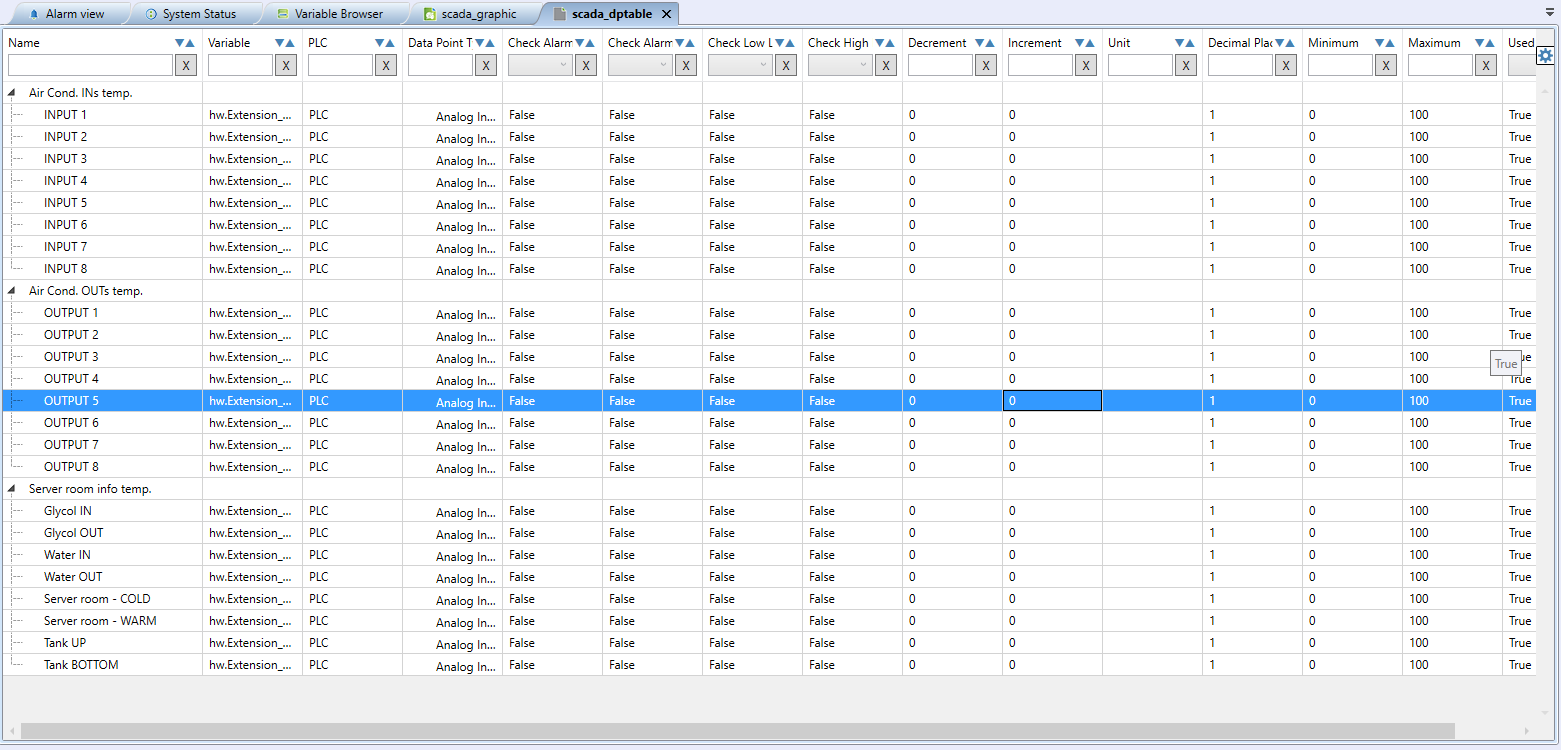 List of data points in Mervis IDE.
If your project requires more than 24 data points, you will need to configure the project manually in Mervis IDE and extend it for the number of sensors needed. If you are not acquainted with Mervis IDE, get in touch with us, or visit our descriptive Mervis tutorials available on this link.
Practical demonstration of the project
The project is currently installed in the Unipi data center for monitoring of air temperature in the air conditioning system. Sixteen temperature sensors are placed in the individual server rooms and read input and output air temperature values in air-water heat exchangers. A pair of sensors is used to monitor the temperature in the upper and lower part of the accumulation tank, another pair measures the input and output coolant temperature. The remaining four sensors monitor the input and output coolant temperature in roof-mounted heat exchangers.
The demonstration project is available on scada.unipi.technology (login and password are already filled).
Display modes in Mervis SCADA
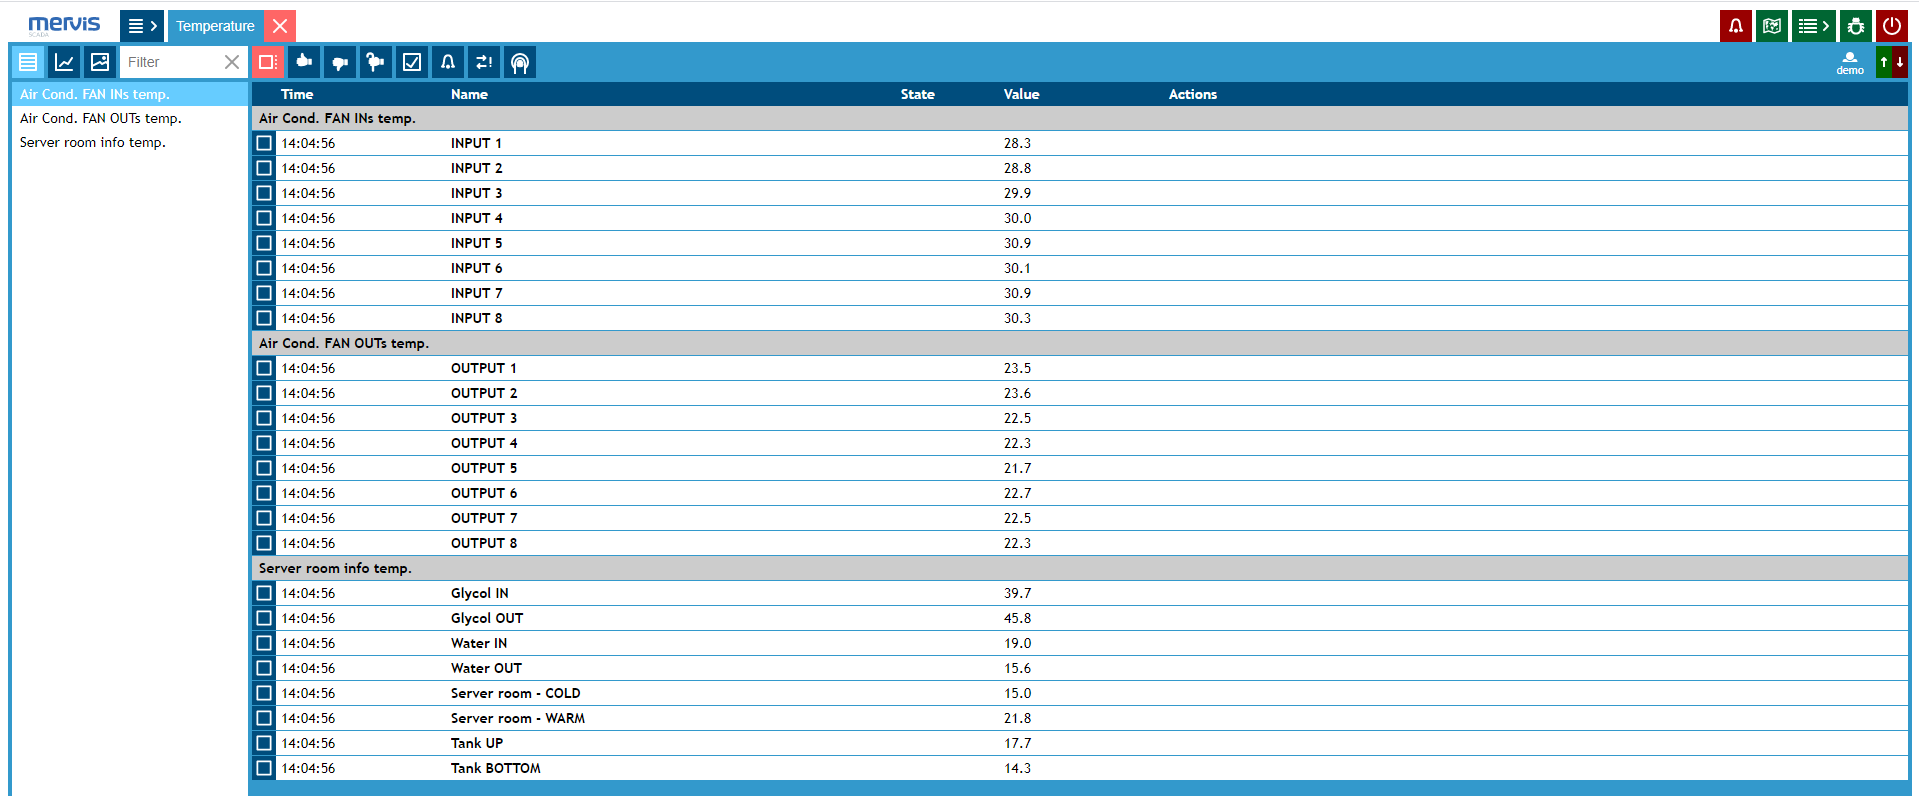
1) Datapoint table
The table offers quick access to all project’s data points, displaying their values in a clean list and allowing the user to change them. If needed, you can hide some of the data points and leave only those you currently use.
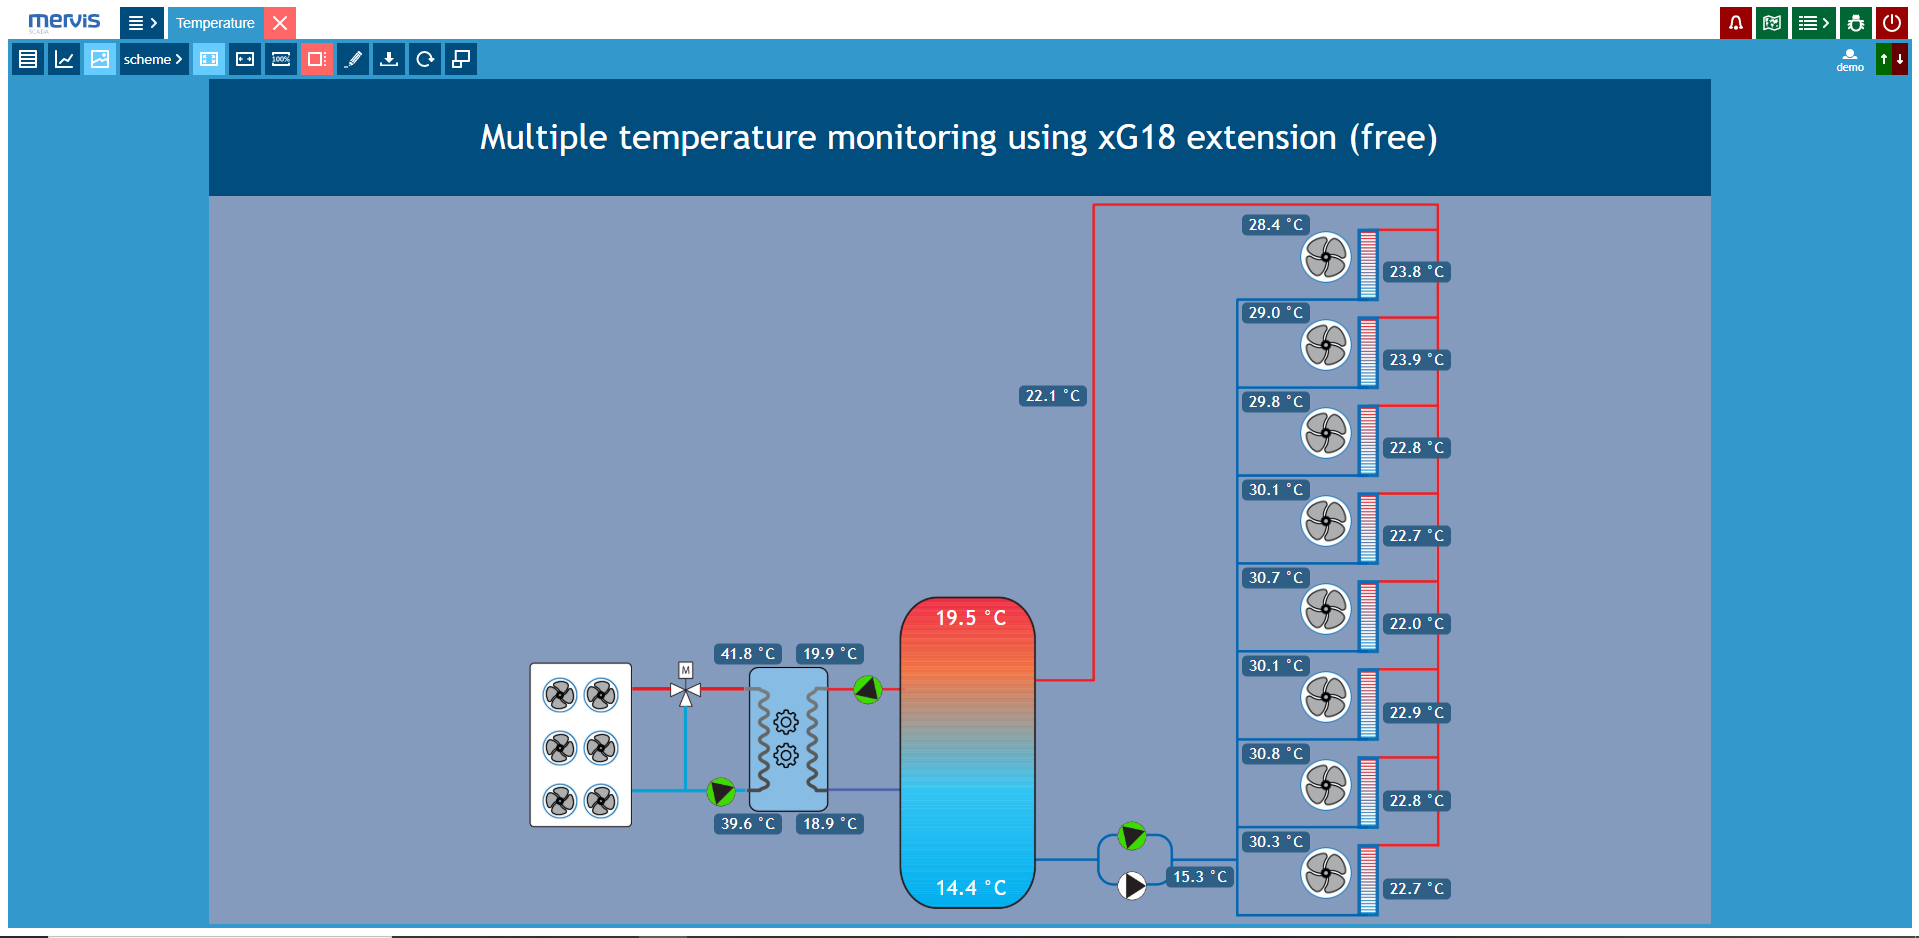
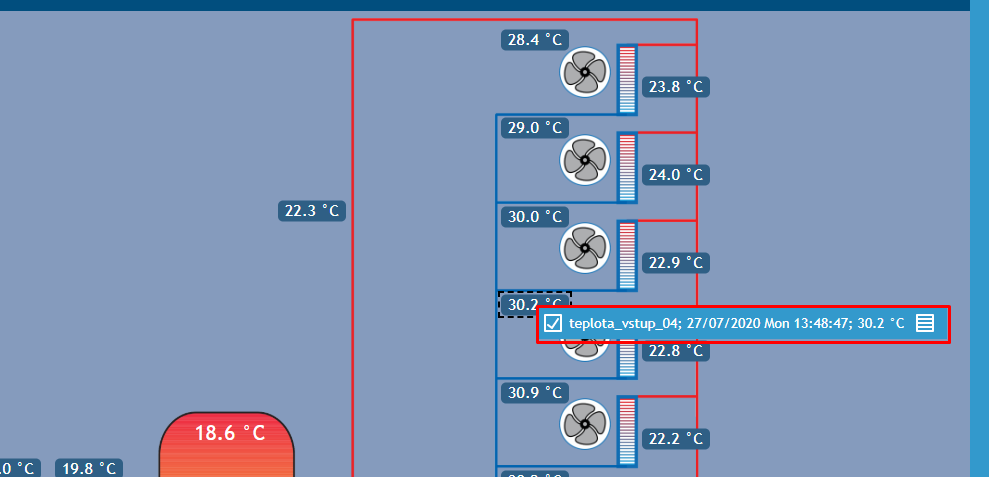
2) Graphic schematic
On the right part of the screen, you can see the input and output temperatures of air conditioning units installed in the individual server rooms. In the middle of the screen, there is a visualization of temperatures in the accumulation tank, heat pump, and roof-mounted heat exchangers. The operation of all fans and pumps is indicated by animated icons.
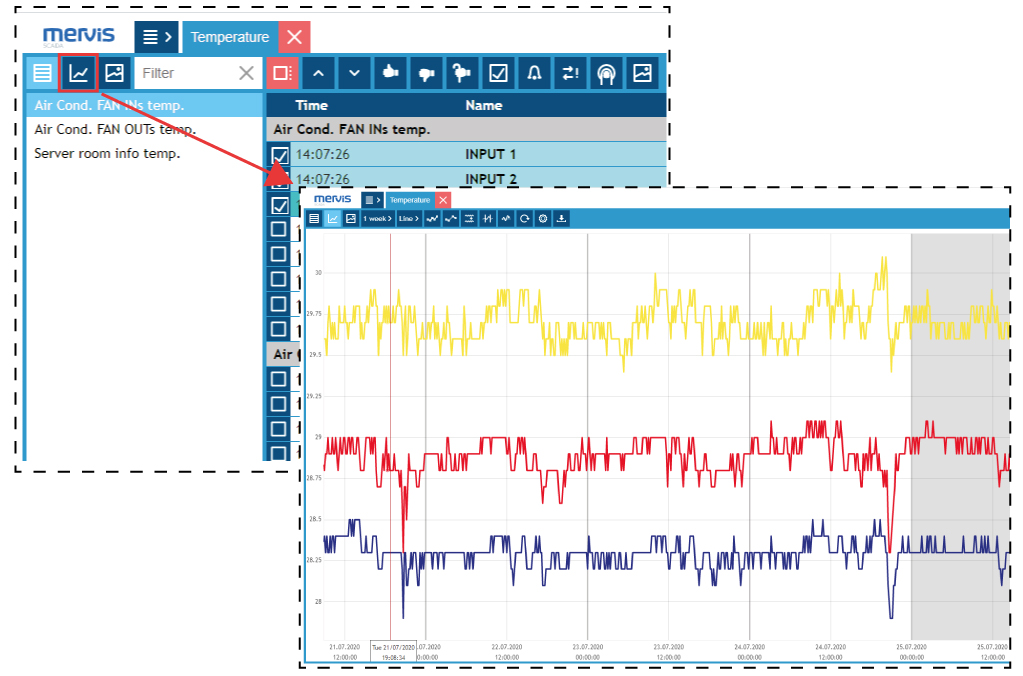
3) Historical data graph
A very useful feature of Mervis SCADA is the visualisation of value history in the form of one of the available graphs. This gives you the option to retrospectively analyze and interpret the measured data for system optimization, diagnostics and problem-solving. Values can be added to the graph easily by clicking on any temperature.
Upon switching to the graph mode a graph of selected values will be displayed. On the picture below you can see a weekly graph of three monitored temperatures. A precise value in a given time can be displayed by hovering the cursor over one of the graph’s curves.
About Mervis SCADA
Mervis SCADA is part of the Mervis platform - the officially supported software solution for programming of Unipi controllers, with Mervis SCADA being part of the Mervis Cloud package. It is a cloud service for remote management, control, and analysis of historic data, which allows you to monitor and control all connected systems through a clear graphic interface independently on their location.
What are the main advantages of Mervis SCADA?
- available for free - all tools needed for development and management of SCADA, including a mobile app, are available free of charge,
- quick and easy deployment - an entire SCADA project can be created only by yourself even without any deeper programming knowledge,
- fully secured solution - your data are safely stored in an Unipi datacentre and access to them is protected by a secure connection,
- user-friendly environment - Mervis SCADA features a clean and modern user interface for making your work easier,
- access from anywhere, anytime - access your SCADA interface from computers or mobile devices,
- analysis of historical data - visualize historical data in descriptive graphs for optimizing your project, diagnostics, and simpler issue solving.
What Mervis SCADA consists of?
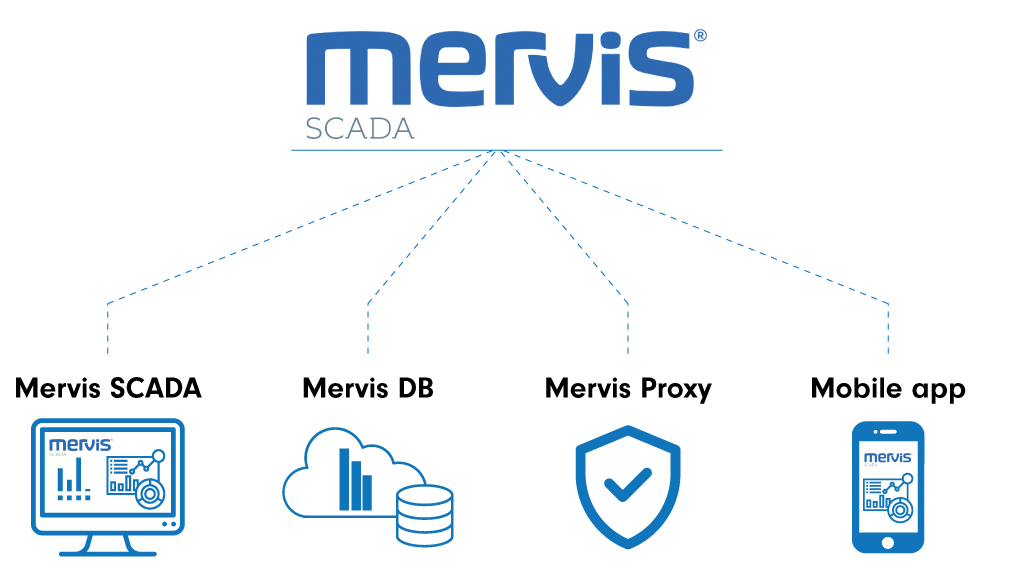
Mervis SCADA itself is an online service accessible through a web browser or a mobile app. The service merges access to controllers and their variables (Mervis Proxy) and access to historical data and their analysis (Mervis DB) into a single interface.
Mervis DB is an optional part of Mervis SCADA designed for storing values from Unipi controllers and their visualization and analysis in a modern web interface.
Mervis Proxy allows remote management and programming of connected controllers via a secure connection that does not require any non-standard network settings (port forwarding, public IP address etc.)
The mobile app gives you the option to access your SCADA interface anywhere on the world directly from your smartphone. Among its other features, the app allows you to display a table for monitoring and changing data point values or to display graphs of historical data.
More detailed info about Mervis SCADA is available on this link.
Further info
- practical project demonstration (login and password are already filled in)
- learn more about Mervis SCADA
- learn more about Mervis
- Unipi homepage